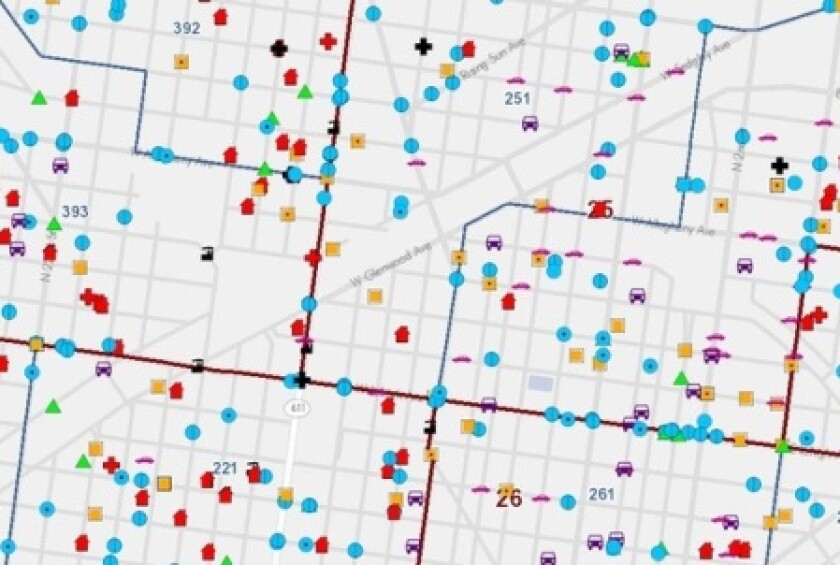
Crime in Philadelphia
The City of Brotherly Love joins other major cities like Chigaco and Baltimore with its release of data on major crimes from 2006 to present day. Recent crimes are mapped, with a live link that lets users provide tips to the police.
Bikeshare rides in Boston
Historic trip data was released by Boston's Hubway bikeshare system in 2012, prompting developers to create data visualization tools that map average speeds between different bikeshare systems. Capital Bikeshare in Washington, D.C. and Nice Ride in Minneapolis, Minn., publish trip data as well.
Public transit in Atlanta
Until recently, Atlanta was one of the few remaining urban areas that hadn't released public transit data. October marked the reversal of this long held policy, clearing the way for developers, outside of Google, to create tools using real-time transit information.
As reported by Government Technology earlier this year, Blight Status was launched in New Orleans to help citizens keep tabs on blighted properties throughout the city.
Pedestrian injuries in San Francisco
A leader in open data, one particular data set from the City by the Bay is having a transformative impact on traffic safety. Pedestrian injuries and fatalities are mapped, revealing the most dangerous corridors. Officials can now align traffic safety dollars to the areas with the greatest need.
Green roofs in Chicago
Environmentally conscious Chicagoans can access a map of the city's 5 million square feet of vegetated roofs, including the one that sits atop City Hall.

Rat sightings in New York City
Daily information on rat sightings in New York City comes from 311 service requests. Results can be mapped using the city's data portal. Atlantic Cities writer Emily Badger, however, hopes a data guru will do this one better. "...we're holding out for someone else to do this with a bunch of tiny rat icons," her article reads.
Tsunami sirens in Honolulu
Adapting the Adopt-A-Hydrant code generated by Code for America, a map of tsunami sirens in Hawaii was created, hoping to inspire citizens to report maintenance issues on their local siren. The strategy is working, as the map below indicates. Green icons indicate that a siren has been adopted, while orange icons represent a siren that still needs a monitor.
Dangerous dogs in Austin
This Texas city requires dogs deemed dangerous to wear large ID tags and be restrained at all times. A map now reveals these animals' addresses and physical descriptions, warning, for example, of "Puppy Wuppy" on Warrington Drive.
Fixed speed cameras in Baltimore
It's tough to claim that Baltimore's strategy of using fixed speed cameras to catch traffic scofflaws catches drivers by surprise. The city offers an online map with specific location information, including the direction the cameras are facing.
Image: Honolulu Adopt-a-Siren map
