Data is a powerful public tool in understanding what is happening throughout a community. States and localities are using visualization to make data more accessible to those without data literacy, largely replacing other less interactive tools to relay data, such as spreadsheets.
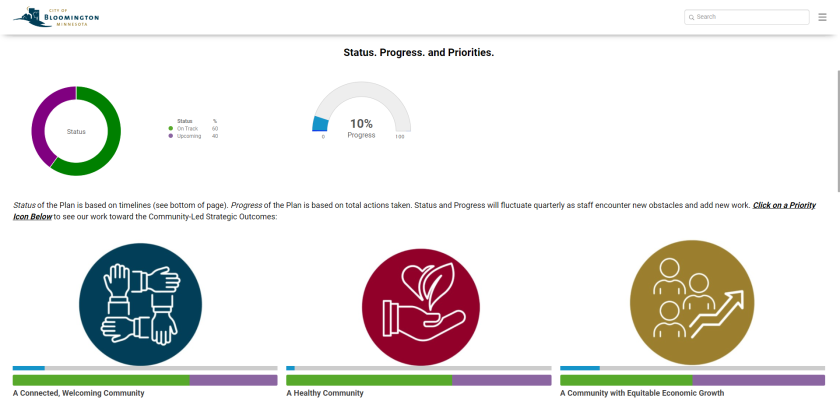
The plan centers the city’s three community-led strategic outcomes — a connected, welcoming community; a healthy community; and a community with equitable economic growth.
Michael Sable, assistant city manager, explained the strategic plan does several things to keep these outcomes at the center of work across departments. First, it gives the City Council improved clarity to understand and talk about things in the community. Second, it helps staff internally align initiatives within one or more of the three city priorities. Finally, it helps integrate initiatives that touch on all three of these issues.
“We’ve really sort of made this come to life in a way that our residents can feel and understand,” Sable said. “For me, it’s the simplicity of the talking points, but it’s also the integration of the services that we deliver.”
According to Noah Faldet, management intern for the city, the city’s strategic plan is unique because developing it was a very community-intensive process. As such, the community was looking to better understand the progress that had been made, which led to the creation of the Bloomington. Tomorrow. Together. (BTT) Strategic Planning Dashboard, which was created in collaboration with Envisio.
Briana Eicheldinger, the city’s finance office coordinator, said that prior to this public dashboard, the city would track strategic plan progress through a Word document. Departments would make updates manually, which would be compiled and sent back out.
“So, as a staff person, I think it’ll be really helpful for just having an understanding across the organization of how things are changing — where our focus is turning in the next several years,” she said. “It puts everybody on the same page because we can track it together.”
Eicheldinger noted that this effort has also encouraged collaboration between departments and energized the work of city staff to align projects with these initiatives.
“There’s a lot of buzz around, ‘How are we going to put this on the dashboard?’ or ‘Is this an initiative that we want to rise up to the strategic plan level?’” Eicheldinger said.
Faldet noted that the team at Envisio offered intensive training to help city staff understand the dashboard’s features and solve for any issues.
As Envisio co-founder and CEO Mike Bell said, the platform’s data has two components, both quantitative and qualitative. The relevant data includes performance measures of various actions and input from stakeholders on the quality of those measures.
Bell argued that what makes this project unique for the city of Bloomington is the community’s participation in creating the strategic plan, rather than having one developed primarily by city officials. He also underlined that the team’s excitement about the project has energized the work.
Bell believes this work in Bloomington illustrates a broader trend of government entities aligning their work more closely with community needs.
Looking forward, Faldet hopes to see the dashboard evolve as the city works to integrate more of its GIS mapping initiatives with the software.
“It’s about striking a balance between the incredibly tech-savvy residents and those who are not as tech-oriented,” he explained.
By helping the community better understand the work that government is doing, Faldet believes this is going to help the city build trust with constituents.