The new toolkit presents data about housing, workforce and skills, and broader economic trends in a more accessible way, explained David Gilbert, assistant director of human services for the city.
"I think this is a very great educational piece for businesses and residents of cities to be able to get this information — and an attraction to bring in people into the city that may be looking for certain things,” Gilbert said, pointing to the tool's simplicity of analysis and access to information about Miami-Dade County's largest city.
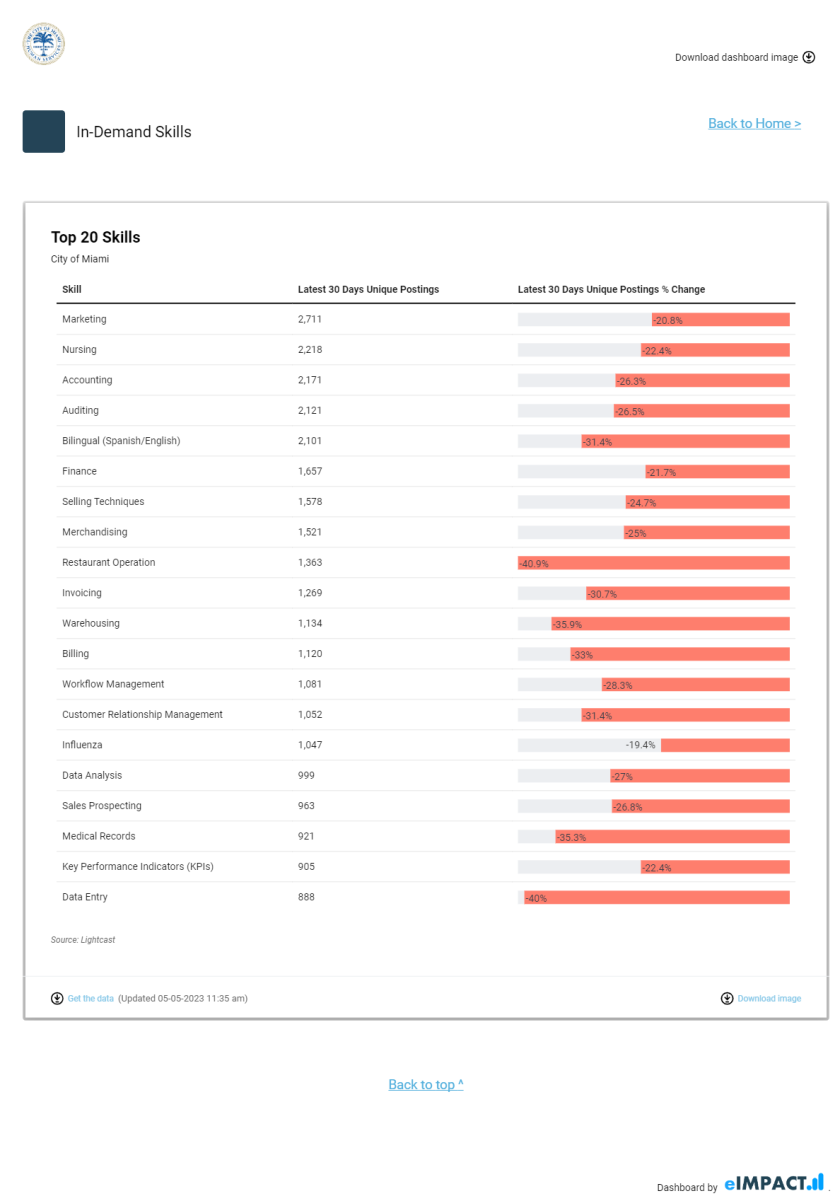
All told, there was two-week turnaround to create an interactive visualization that hinged on ease of use and clarity of information. A clear vision and iterative approach helped city staff and the eIMPACT team to build the tool quickly.
The creation of the visualization is typically an iterative process, explained eIMPACT CEO and co-founder Erik Larson. The eIMPACT team develops a visualization to share with the client, the client provides feedback to better suit the end user needs, and adjustments are made.
In Miami's case, the team had notes about the interactive component of the dashboard. Originally, the design layout was essentially a large, scrolling visualization, but the team decided that it needed to be easier to navigate.
“The city of Miami wanted to change that to something where users can navigate with buttons and get to the data they want to see, but not all the other data, and then come back to kind of a home screen, so we made those changes,” Larson said.
Because a city’s labor market is something that will continually be evolving and changing, the city’s needs and focus areas of the information presented may also change. As such, the dashboard can evolve over time. The city can communicate new needs to the company, who will adjust the dashboard as needed.
Internally, there has already been a positive response to the dashboard, Gilbert said.
“From a perspective of a city, looking at workforce in this manner, it was so unique to everybody that we were even going down this path ...,” he said.