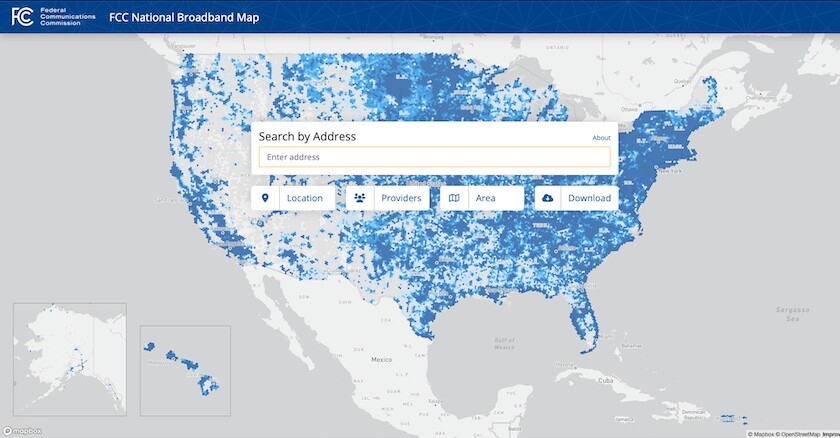
On Nov. 18, the FCC released apre-production draft of a new nationalbroadband map. Since then, state, local and tribal government entities, broadband service providers, and the general public have submitted data to help identify broadband availability nationwide, with the idea being that their submissions will help create a more accurate map.
This availability data will help inform the National Telecommunications and Information Administration (NTIA) on how to best allocate $42.5 billion in Broadband Equity, Access and Deployment (BEAD) grants to states and territories by June 30. For context, the FCC’s map uses geolocation data to show two separate data sets: a “broadband serviceable location fabric” and “provider-submitted service availability data.”
Currently, two versions of the broadband serviceable location fabric have been released, with a third version not far off, and there are, of course, differences between each.
According to the FCC, “the fabric itself is not a map. It is an evolving database of all broadband serviceable locations nationwide that are used in the production of the map when combined with information from service providers and data about service availability and current service offerings from the challenge process.”
An FCC spokesperson identified the following differences between the fabrics:
- The first version of the fabric is currently displayed on the national broadband map.
- The second version was made available to providers, states and other license holders in late December.
- The third version, which will likely be released in June, will serve as the basis for the summer collection and will show on the public map in the fall.
Dustin Loup, program manager for the National Broadband Mapping Coalition, explained how FCC data collection deadlines could also help identify the differences between each fabric and how they will ultimately impact state funding.
For example, when the first version of the fabric was released, the FCC encouraged users to visitbroadbandmap.fcc.gov to search for different addresses, verify served or unserved locations and submit data to rectify missing locations.
- For Internet service providers — and state, local and tribal governments — this process started in June 2022.
- In September 2022, providers and governmental entities could begin submitting challenges to the first version of the fabric.
- In November 2022, the first version of the fabric was published and made available to the general public. Individuals could then file challenges with the FCC through the map’s interface to fix any missing or incorrectly marked locations.
- Finally, on Jan. 3, 2023, facilities-based broadband service providers started submitting broadband availability data to show where they made mass-market broadband Internet access available at the end of last year. The deadline for this data collection was March 1.
WHY IT MATTERS FOR STATES
According to Loup, the reporting from the March 1 deadline will be available sometime in early to mid-June, and once that information is published, that will be version two of the public map and will help determine funding levels.
“That version, combined with the adjudicated challenge process, will determine BEAD allocations to states sometime on or before June 30,” Loup added.
The next date to look out for is March 15 — the deadline for any challenges to the location data for version three of the fabric.
“This is the version of the fabric that providers will report on from June 30 to Sept. 1 and will likely be available to the public sometime in November,” Loup said.
He also added that the updated map could play a role in administering BEAD funds across different states and territories.
For example, according to the National Telecommunications and Information Administration, each state will receive a minimum of $100 million in funding for broadband deployment from the Bipartisan Infrastructure Law.
“The FCC’s map is critical to determining how much in funding each state will receive beyond that $100 million,” an NTIA spokesperson said via email. “NTIA will divide the total amount of funds for the program among the states and territories based on the number of unserved locations in a state divided by the nationwide total of unserved locations, with 10 percent reserved for distribution based on the number of high-cost locations that exist within each state or territory.”
Each state will receive funding based on its relative need, the NTIA spokesperson noted, though the mapping effort will not necessarily determine where the funds are allocated by each state.
“It will be the states — not the FCC map — that will determine where funding goes to build high-speed Internet infrastructure in their communities,” the spokesperson said, adding that funding locations must be identified as “broadband serviceable locations” on future iterations of the FCC map to be considered eligible for BEAD funding.
WHAT COMES NEXT
Between July and August, states will submit their five-year action plans to the NTIA, detailing how they aim to use allocated BEAD money to connect unserved or underserved areas to the Internet.
Once this data is submitted, version three of the FCC’s broadband serviceable location fabric will be released in November.
“This version three of the maps might be of note, less so for the allocation of the BEAD dollars, but more so for the administration of the BEAD program within states and territories as they identify in their proposals for unserved and underserved locations and how they’re going to reach all of those locations,” Loup said.
In the second quarter of 2024, he added that states’ final proposals would be due and incorporate version three of the FCC broadband map and their data challenges.


